How to Create Infographics That Will Engage Members

It’s natural for people to be drawn to visual representations of content, rather than plain text. Why? Because visuals help eliminate text overload and offer a more engaging and easier way to recall information. Is your association taking advantage of infographics as a marketing tool?
What exactly are infographics, and why should my association be using them?
An infographic is a visualization of data or ideas that conveys complicated, detailed information in an easily digestible manner. Ninety percent of information transmitted to the brain is visual, and visuals are processed 60,000 times faster in the brain than text.
Without a doubt, people love stats, facts and figures. You can incorporate infographics within your association’s magazine, on a conference landing page and much more; and in turn, this helps your association:
- Increase awareness of your association.
- Recruit new members and staff.
- Generate traffic to your association’s website.
- Show expert understanding of the subject and/or your industry.
Therefore, using infographics is a great step toward improving the content in your social media feeds and blog, as well as toward increasing the amount of engagement you receive from current and potential members.
![]()
You don’t need a graphic designer or expensive software to create eye-catching infographics.
Keep data-filled ideas to a minimum with infographics to help members retain more information in a short amount of time.
The key to producing successful infographics is offering good, relevant data in an exciting visual style.
Infographics are a great tool to engage and visually connect with your association’s members.
Getting started
Think about how much information is generated on a daily basis via the Web. It’s easy to become lost in a sea of tweets, videos, news articles, blog posts, and ads, which can make it difficult for members to see and share your valuable content. If you’re not already creating infographics, now is the time to dive in and really grab your members’ attention.
But before you begin creating infographics, you need a plan. Follow these steps to put together a solid course of action:
- Decide what your goals are. Why are you creating this infographic? Will it solve a common member issue? Note: One of your main goals should be to provide members with valuable information worth sharing with colleagues or potential members.
- Research or capture intriguing data. Infographics offer a great opportunity to inform members about the turn out of your annual event or the results of a recent industry report. Your infographic needs to read like a story, with a beginning, middle and end.
- Design your infographic. No need to go all-out for your first infographic. Keep things simple and gradually include more content, images, and data within your infographics. Be certain to cite credible sources, if necessary, at the bottom of your infographic.
- Brand your infographic. This is an important step as you want to ensure your brand is credited which your infographic is shared on social media or within an article.
- Make it share-worthy. Whether you include quotes, a relevant hashtag or a Facebook share button, make sure your members are able to easily share your infographic. If you’d like to take things a step further, you can include an embed code with your infographic so others have the ability to post it to their website.
Creating shareable infographics
Now that you’ve put a plan in place, it’s time to begin creating your infographic!
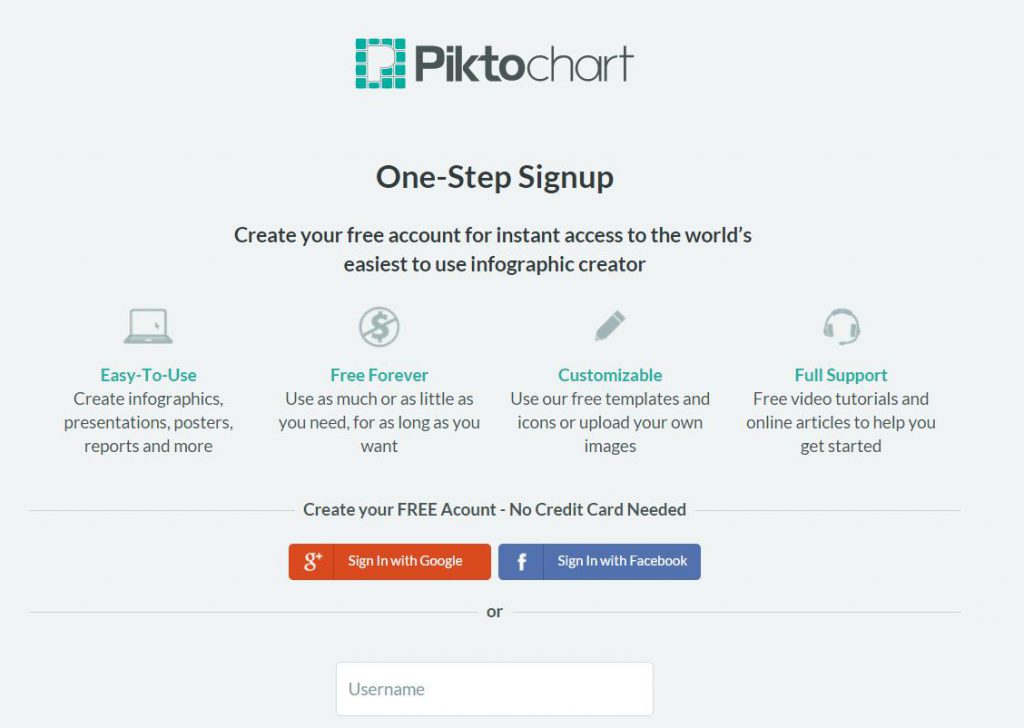
- Most importantly, conduct research or select a piece of information to visualize (with permission from the source). This is one of the first steps to create a successful infographic. Once you’ve compiled and organized all of your data, you may open your infographic tool of choice. For this example, I used a tool called Piktochart.
- Once you enter the site, you will need to sign up. (Don’t worry; it’s free!)
3. After you sign up, you may select the infographic format and template you want to use.
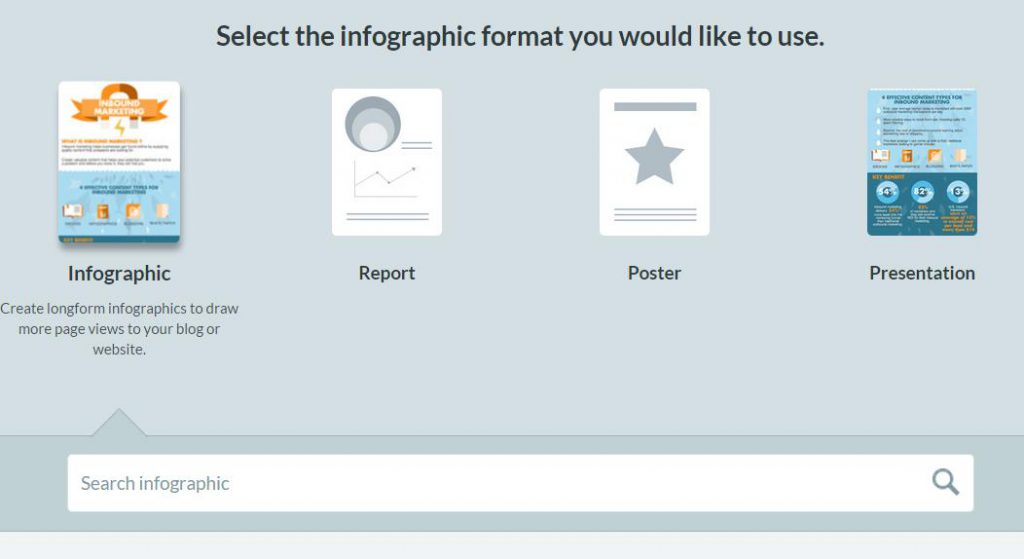
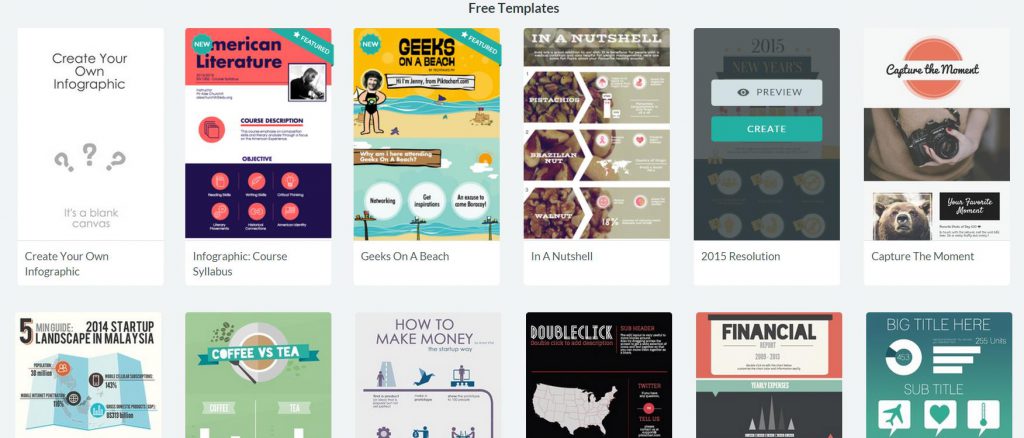
Depending on the tool you use to create the infographic, your choice of templates will vary. I recommend selecting one that visually fits best with your topic.
- Insert data and customize. Take all of the data you pulled from Step One and enter it into your desired template. Make sure the data, content and graphics are inserted into the template in a visually appealing way. Tip: Add icons, such as arrows, to determine the flow of your infographic.
As you can see, creating infographics by using a tool such as Piktochart is efficient and easy to do.
Infographic tools to help you get started
Here are three more infographic creation tools you can try:
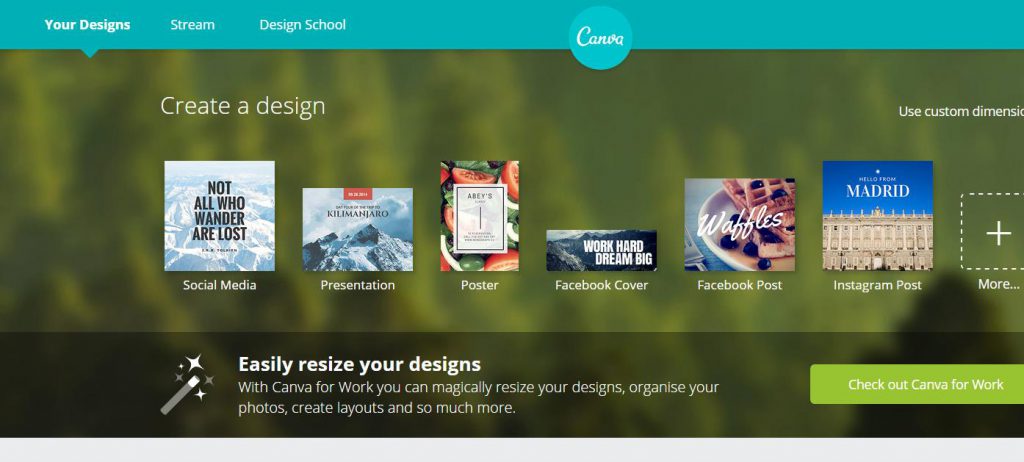
- Canva – One of the better known infographic design tools, Canva allows you to design your infographics with hundreds of free elements and fonts.
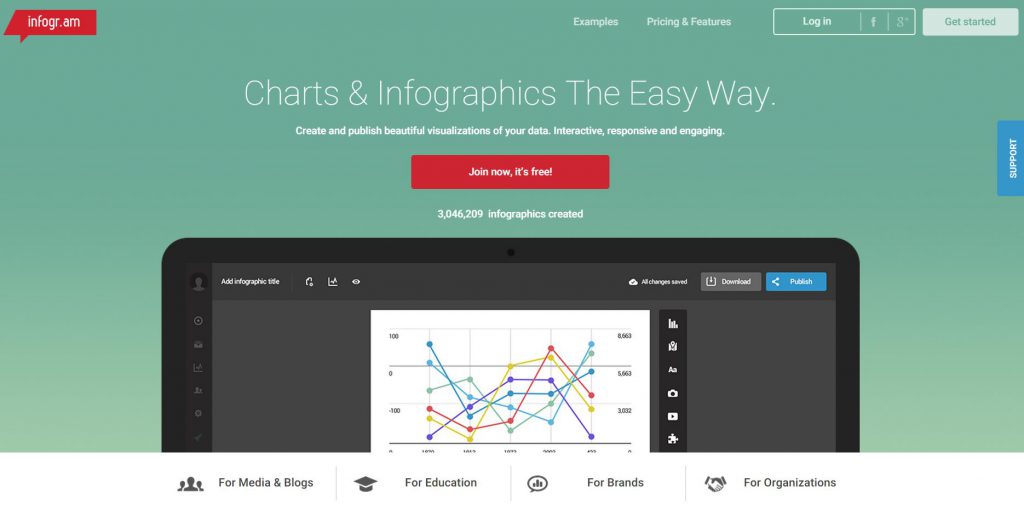
- Infogr.am – Another free infographic tool, Infogr.am is designed to help you easily create and publish visualizations of your data.
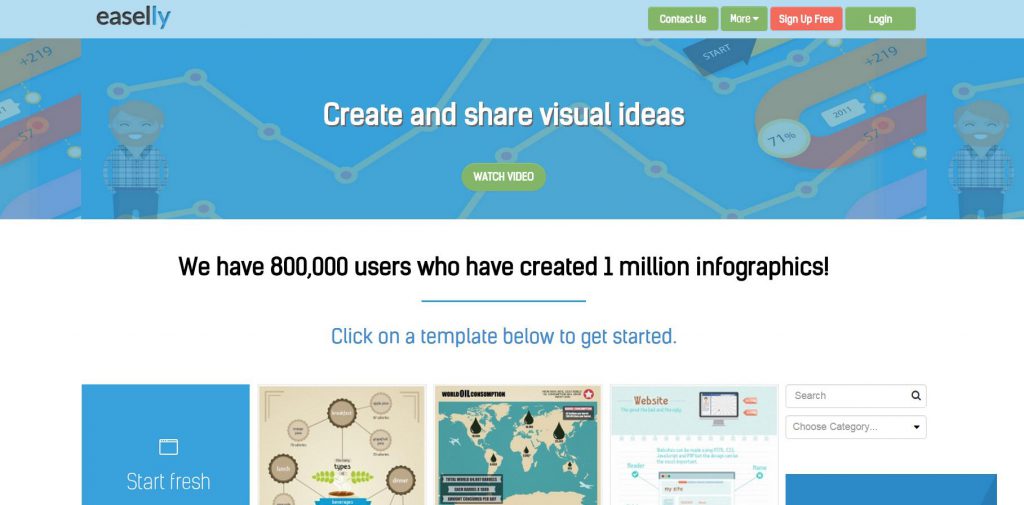
- Easel.ly – This site features thousands of free infographic templates and design objects. Easel.ly makes the process of creating infographics easy by utilizing drag and drop elements, image upload and more.
*Disclaimer: Neither Association Adviser nor Naylor Association Solutions has a commercial or promotional interest in the products/services mentioned in this article.
Before you decide which tool to use, browse these sites and check out the interfaces to see which best suits your needs. To determine this, decide which tool has the most appropriate templates, design options, and ease of navigation to best present data to members. Do you need a simple tool that allows you to create infographics in a short amount of time? Are you searching for a tool that has everything you need to create more than just infographics, such as flyers, postcards, and more?
Don’t be discouraged if you have trouble getting started. It may take practice before you are able to create a stunning infographic your members are eager to share.
How associations are using infographics
By keeping data-based ideas clear through infographics, members can retain more information in a short amount of time. Your member database contains all kinds of useful information. Take this data and use it to teach your members without them even realizing it, and at the same time increase your readership, membership, and member participation numbers.
Let’s take a look at a few examples of how associations are using infographics to better connect and engage with their members. These examples might even spark a few ideas for your first one!
- The American Society of Association Executives has an infographic on its website that features a detailed look at room capacities in various set-ups for their conference center.

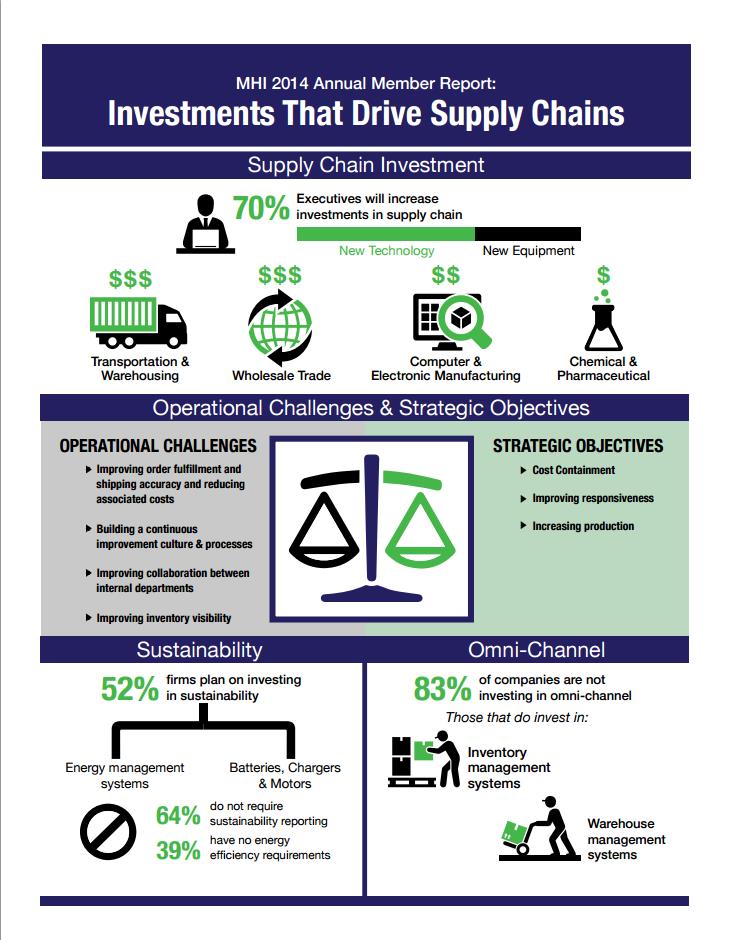
- The Material Handling Industry creates an infographic for non-members detailing selected findings from their annual industry member report.
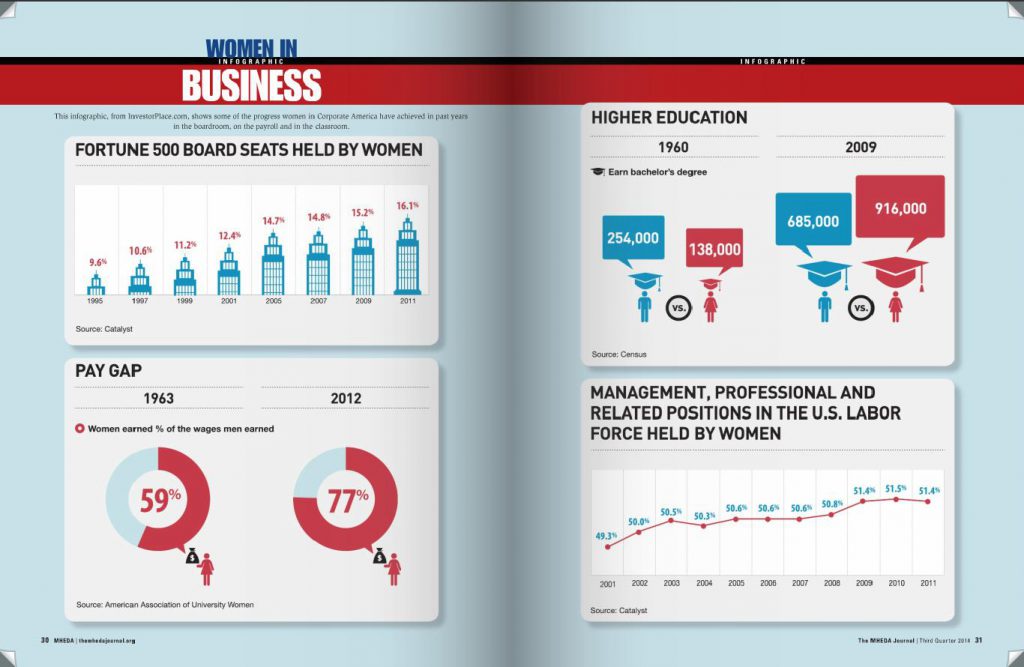
- A past issue of The MHEDA Journal, a publication by the Material Handling Equipment Distributors Association, features an infographic about the progress women in corporate America have achieved in past years.
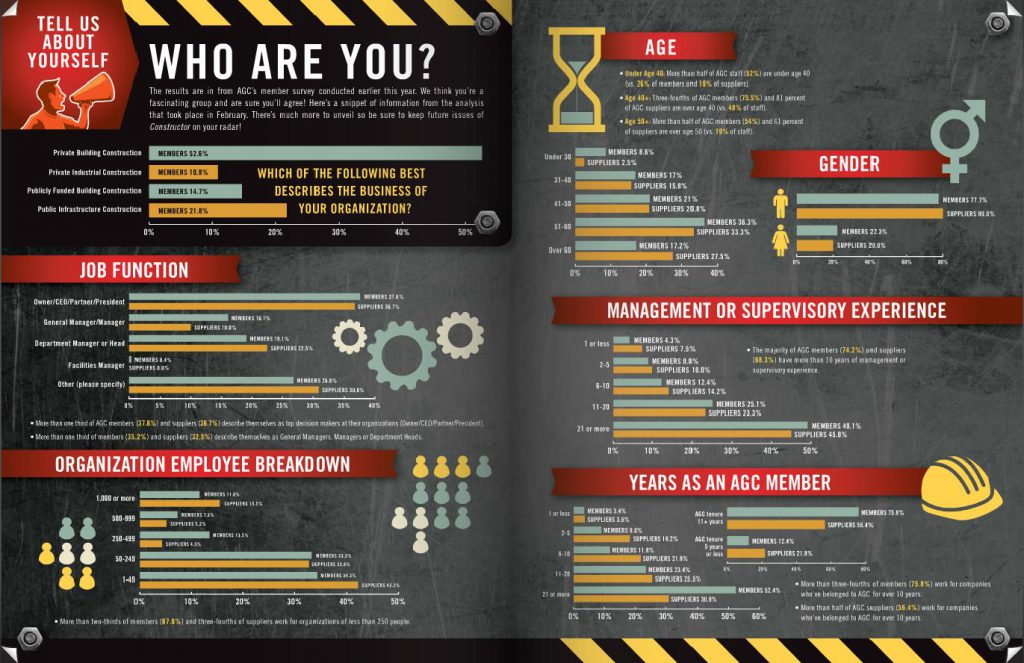
- A past issue of Constructor Magazine, a publication of the Associated General Contractors of America, features an infographic with the results of AGC’s annual member survey.
In another issue, Constructor included an infographic of data from their work zone safety study.

Conclusion
The key to producing successful infographics is to offer good, relevant data in an exciting visual style, presenting information in a concise format that is easier understood than through words or video. The best infographics don’t strive to go viral overnight, but instead beg to be consumed and continuously travel among members and non-members.
Remember, you don’t need a graphic designer or expensive software to create eye-catching infographics. By using one of the platforms mentioned above, you can take advantage of one of the most powerful tools in your content marketing arsenal you didn’t know you had.
Did we miss a great infographic tool? Tell us about your favorite in the comments below.
Brianna Lawson is an online marketing specialist at Naylor Association Solutions.
